Contents in short
- Add custom progress indicator to your slides
- Works on Windows and MAC
- Free, open source PowerPoint Add-In
Contact, Download at the bottom of the page, Video demo below the description.

The Problem
PowerPoint is the dominant presentation software, but lacks some helpful features to give your audience a hint how much they have seen already and how much still to be expected. Maybe you have some chapters/sections in your presentation - and you want your listeners also know about those.
There is no internal possibility to create a progress indicator in PowerPoint. There are some scripts on the web - but they are quite hard to find and harder to use. Furthermore: They are way not as advanced as this – free and open source (!) – Powerpoint add-in!
The Solution: This Tool
The Progress Indicator was originally developed by Edgar Loper (Progress Dots), modified by Adam Wilson and heavily extended by Olaf Nöhring.
It should work on Microsoft Office 365/2019 (also 2010 (windows only), 2013 and 2016), 32bit and 64bit versions and on MAC OS as well as on Windows! This page illustrates some features and includes a download link directly from the (last) developer.
Is this macro safe? Yes. Also, you get not only the PowerPoint add-in, but also the source code so you can always check it out yourself (and change it if you like). If you are interested in contributing to the development of the add-in contact me directly (or see the github page to contact Adam).
So tell me, what does it look like? What can it do?
It looks like this, shown is version 1.94 in Windows 10 with MS-Office 2016:

Version 1.922 in MS-Office 365/2019 on MAC OS (as I do not have a MAC, please send me a screenshot. Thanks):

As you see, the Progress Indicator (macro/add-in) will create a new tab in the ribbon. All options on this tab have keyboard shortcuts (press ALT in PowerPoint and watch what happens). The ribbon is split into several parts (Indicator, Shape, Section, Margin, Slide and Ignore), most of the icons are from FatCow.
If change any settings in the ribbon, the Progress Indicator will immediately update (or create) indicators with those settings. Please note, that if you change a value in the dropdown fields by hand, you need to press the Enter key after you have entered the value to make the ribbon recognize the change. If you are working with a large presentation and the automatic updates are too slow, simply uncheck auto-update (then click create when you want to update the indicators). Also good for large presentations: Ignore the indicator, but show sections only. But don‘t forget: If you change your presentation, add/delete/reorder slides/sections you will need to click create to update the Progress Indicator!
We tried to make the Progress Indicator work exactly the same way on Windows and MAC. This was not always possible. Please read the following documentation where we point out known differences.
Did you know? Progress Indicator is featured on indezine.com. If you know about any other reviews, please let me know.

Let's go into some details
Indicator

- Create generates or updates the indicators (the shapes and, if available and used, the section title).
- Remove removes all indicators and titles (draw-start-slide to draw end-slide only). The settings will stay in your presentation. You can use the Create button later to apply the last settings and redraw the indicators.
- The dropdown (here: Sections is chosen) allows to choose between Shapes and Sections (new in version 1.9). If you choose Shapes (default) all shapes will have an equal spacing and the sections will have different width. If you choose Sections, all sections will have the same with, but shapes in the sections will be spaces differently. See the next two images as examples.
Dropdown set to "Shapes":

and here the same slide in the same presentation, when the dropdown is set to "Sections":

- The next field that shows „Full“ in the image is the style you want to apply: Choose between Full, which shows Indicator and Sections, Indicator only and Sections only. Note: Shapes are created but hidden if they are not wanted.
- The two next fields hold draw-start-slide and draw-end-slide: These indicate where the indicator should actually start (default: 1) and end (default: 999) drawing. The start must be larger than 0, end less than 1000. These settings are not saved with the presentation.
Start and end allow you to have different kinds of indicators on different parts of your presentation, for example red triangles in section a, pages 1-5 and custom images in section b, pages 6-8, blue donuts in section c, pages 9-15; or a different indicator style in each section. - If you turn on Auto-Update, every time you change something on the ribbon the indicators will be updated! As Auto-Update redraws all indicators after every change you make, this might slow down your workflow – especially when working with large presentations. Suggested use: If you have more than 20 slides, turn off Auto-Update and always use the Preview button before actually creating the indicator for all your slides using the Create button. Also see the notes on creation speed. When the creation of the indicators starts the information window will appear.
- Preview draws a preview of the progress indicator on the first three slides (that should get one). The current settings are used. This is especially usefull for large presentations where one probably wants to turn off Auto-Update as well.
- Help opens a help window with some hints and tricks – and a link to my website. Here you also find a button to check online for a new version.
A progress indicator for the progress indicator

Introduced in version 1.85 you will see an informational window once you press the Create (or Preview) button or Auto-Update is initiated. The information, as seen in the image, displays the creation progress absolute and relative and gives some information about the number of created indicators and sections (M is medium).
Something very useful is the estimation of the time needed to finish the complete progress indicator and of the estimated end time. This value is recalculated on each new slide and takes in account, that the creation time get's longer with each slide. This seems to be connected to the internal handling of the amount of shapes PowerPoint has to take care of.
Please note, that the estimation is exactly that: An estimation. In tests with approximately 60, 80, 100 and 120 slides it was quite exact after the indicators had been created for about 20% of all slides (or 20 slides).
In case you clicked the Create of Preview button by accident (or forgot to disable Auto-Update) you can now also simply press the Cancel button in the information window. This will cancel the creation after the current slide is finished. Note: As internal code takes up a lot of computing power, you might need to press more than once to make PowerPoint notice that you clicked it.
Shape

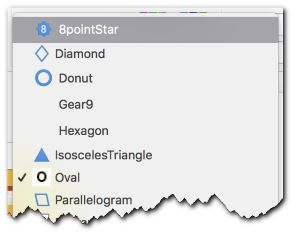
- You can choose the type of the indicator from 196 predefined shapes that come with MS Office. Some common ones can be found additionally on top of the list.
The list of indicators/shapes also contains some with visual hints (Windows and MAC version shown):

- Change the Size of the indicator.
- Set the color for the indicator when a slide was already seen (Seen), is currently shown (Active) and not yet seen (Unseen).
- Fill S, Fill A and Fill U define if the shapes are filled or not, depending if the slide has been seen (S), is currently active (A) or if the slide has not been seen yet (U).
- The four icons below the size let you change the thickness of the outline, it's style and it's dashstyle.
If you make the outline smaller and smaller or will vanish completely. Making it smaller once again, it will be maximized. Also, making a maximized outline even thicker will make it disappear completely. Thus, the thickness cycles: invisible -> 1 .... -> indicator size -> invisible. The possibility of making it invisible was introduced in version 1.922 - The drop down fields allow you to set transparency of indicators for seen, active and unseen slides.
Custom Images
Starting in version 1.86 you can also use custom images as indicators. Just choose the appropriate setting from the dropdown list. Then a new window will appear where you choose your images. Just follow these simple steps:
- Select your three images
- Check the box Use custom images!
- Click the Close button
Warnings: Choose files that are small (width/height + filesize). Choose only images! I tested with png and jpg files.
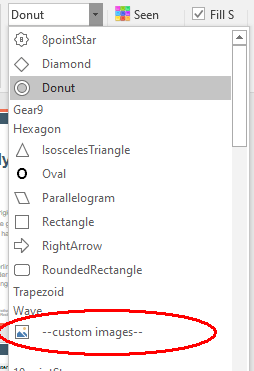

It could look like this. Transparent background in the png files. In PI a green background and a black solid border were set and different transparency settings applied:

Colors
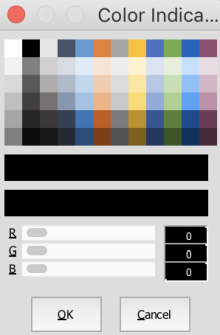


You love colors? Sure you do, and thus we provide you with an easy way to adjust the colors (all of them in Shape, Section) very simple. We created a color-chooser for you (images show Windows and MAC version). Whenever you press a button the color-chooser will open. The title of the window will let you know what color you are working on, the old color, as well as a preview for the new color will be displayed.
The color chooser allows to change the colors by
- choose from a set of colors. These colors are calculated each time from the current theme colors. This means, after changing your theme you can easily adjust the indicator colors to match!
- typing red-green-blue (RGB) values (0-255)
- dragging the RGB sliders
Easy navigation with hyperlinks
Each indicator is also a link to that slide, so are the section titles. Links work only when you start your presentation, not in design view!
- Clicking on the indicator will take you to the specific page
- Clicking on the section title will take you to the first page of that section.
- Windows version only (sorry Mac users): When you hover (mouse over) the indicator/section title you will see something like this: 262,7,Regular visible,3
- 262 is the ppt internal presentation unique ID which never changes (and is needed for the link to work)
- 7 is the slide number in your presentation "development" window
- Regular visible is the slide title (is one exists, otherwise "-" will be shown)
- 3 is the slide with the third indicator

Section

Sections are a Powerpoint feature to organize your slides into different parts. Think of those as topics or chapters in a book. You can add sections in development view in the miniature view or in the slide sort view by simply right clicking and choosing Add Section. See the official help on using sections in Powerpoint or let Youtube show you how to use them.
The Progress Indicators will divide the indicators by section and display the section names above (or below) the indicators.
If you section has the special joker name PISectionnameHidden, there will be no name in the section title displayed but only empty space. This is used in the (rare) situation that you want to show the indicators for a section without showing a section name. You can have more than one section with this name.
Starting in version 1.827 you can also have a section with the special name PISectionHidden. None of the pages in this section will get an indicator and/or section title. This makes it easily possible to have some backup slides which nobody notices but which are available in case you want to show them. Probably you want to place a section with this name at the end of your presentation. You can have more than one section with this name.
Sections without a slide will never be shown.
You can decide not to show section titles by checking the Ignore Sections (see Ignore)
Available settings include
- Font (Arial, Calibri ..., you can also choose from all installed fonts!)
- Fontsize
- Color for the font and background of the titles when a slide was already seen (Seen), is currently shown (Active) and not yet seen (Unseen)
- The option to use the background color or not (which would show the background color of your slide) for seen, currently active and unseen sections: BG S, BG A and BGl U . As many people do not seem to use sections the default is not to use any section backgrounds. Of course you can define the colors using the buttons in the same way as described above.
- Checking „Below“ will place the section titles below the indicator shapes.


- The drop down fields allow you to set transparency of sections for seen, active and unseen slides.
When you select from the Font dropdown there is also a "...more..." option (Windows and MAC version shown).


Choosing this will open a new window where you can select from all installed fonts on your machine (MS-Word might open in the background but close directly again – the add-in reads the installed fonts from there). Please note: If you choose "...more..." and want to choose another font from the list afterwards again, you need to choose one of the other fonts in the list first. Windows and MAC version shown.
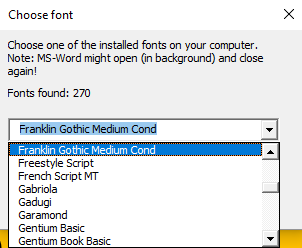

You also get a preview of how the selected font will look.

Margin

The settings in this area are for the progress indicator in general (Left, Right, Top), for the sections (Space) and the indicators in the sections (Squeeze) and the vertical space (Gap) between the section titles and the indicators.
Please note: You can enter values by hand. We noticed, that on MAC the values you enter will be used, but not displayed in the ribbon correctly (MAC only displays values that are present in the dropdown list).
- Left and right margins for the indicators / sections (if 0 the section titles will start on the left and end on the right side, negative values are possible)
- Top defines space to the top of the page. A very large value will place the indicators / sections on the bottom of your presentation. Negative values are possible.
- Space defines space between different section (titles)
- Squeeze (or Spread) influences the space between the indicators in each section. Large negative values result in funny effects (try once!)
- Gap lets you set the distance between the section titles and the indicator icons
Slide

- You can use the ribbon (area Slide) to Skip a page or Repeat the last visible indicator page, or revert back to Normal.
- By clicking the Skip button the slide will get a specific comment and usually not get an indicator (but are displayed when you start your presentation).
- By clicking the Repeat button the slide will get the same indicator and section as the last visible PI was (new in 1.864).
- You can remove the comment either by using the Normal button or by simply removing the comment by hand.
- You can choose to ignore the Skipped and Repeat comments by unchecking Ignore Skip+Rpt . This will place indicators on your Skipped and Repeat pages as well in the regular way (see Ignore)
In the following image you can see that slides with number 28 and 29 have the same indicator as slide with number 27. On slide 28 and 29 the Repeat-button was used.

Ignore

In this area are currently only two settings.
- Skip+Rpt: Checking Ignore Skip+Rpt will place regular indicators on your Skipped and Repeat pages as well.
- Hidden: It‘s a basic PowerPoint feature, that you can hide slides from being seen when you start your presentation. Hidden slides are represented in development view with their number strikethrough like this:

Hidden slides do not get progress indicators by default! If you want to put progress indicators also on hidden slides, you need to UNcheck Ignore Hidden - but keep in mind: PowerPoint will not show you hidden slides when you start your presentation
Visibility

This area of the ribbon contains two dropdown lists. The first is for the visibility of sections (characterized by the rectangle), the second for the visibility of indicators (characterized by the star).
For sections you have the following options:
- Full (default): This will draw all sections.
- Space only: This will only keep the space each section needs (you can see differences, when you choose this and toggle the dropdown in the indicator area of the ribbon from Sections to Shapes and vice versa).
- None: This will totally ignore sections. It's like your presentation does not have any sections.
Note: This also applies to the display of the sections and may change the display of your indicators as well. As sections are ignores, the setting Active Section for indicators will display all indicators.
For indicators you have the following options:
- All (default): This will draw all indicators as expected.
- Active Section: This will draw indicators for the active section only. For example: If your first section has 2 slides, the second section has 7, you will see 2 indicators on slide 1 and 2, but you will see 7 indicators in section 3 (slides 3 ... 9).
- None: No indicators will be drawn at all.

Install / Uninstall / Edit / Update / Upgrade
Updating Progress Indicator:
Make sure you disable the old version before installing the new version. You can always disable the new and enable an old version.
To install Progress Indicator on Windows:
- Open PowerPoint
- Under the "Tools" menu, select "Add-Ins"
- Click "Add New"
- Select the file "ProgressIndicators.ppam" (the file with the ppam extension)
- Click "Enable Macros"
To install Progress Indicator on a MAC
- Open PowerPoint
- Select the Tools menu and then “PowerPoint add-ins"
- Click the little plus at the bottom to add a new add-in -> click OK
- Selected the ppam file
- Approve the security warning to allow macros
To uninstall Progress Indicator
- Open PowerPoint
- Under the "Tools" menu, select "Add-Ins"
- Select the "ProgressIndicators" add-in
- Click "Remove"
Editing
If you'd like to edit the macro, to make your own customizations to it. It would be nice to let me know about this:
- Open the file "ProgressIndicators.pptm"
- Under the "Macros" submenu of the "Tools" menu, select "Visual Basic Editor"
A note on creation speed
Please be aware, that PI creates a lot of new shapes on your presentation. Creating these, can take it's time, depending on the amount of slides you have. Make sure, you turn off Auto-Update! The information windows that shows up when you press the Create or Preview button (or on Auto-Update), will calculate the estimated time for completion.
I have been testing a presentation with 100 slides. All 100 are visible and have no extra PI settings applied to them, no sections have been created. This means, when creating the progress indicator 100 x 100 = 10,000 new shapes will be created. In my case this took about 7 minutes and 10 seconds. Slow? Well, try creating them by hand ;-)

Some examples
Suggestions? Questions? Wishes?
Please let me know using the contact form.
Download and 
Attention MAC users only: The Fill Options (introduced in 1.835) seems to crash your PPT sometimes. Save before using!
- 1.94 Added Style: Choose to see Full (Indicator and Sections), Indicator only or Sections only
- 1.93 Error checks, litte extension of the PI-Progress show (added draw-start- and draw-end-page)
- 1.923 Added: Draw-Start-Slide and Draw-End-Slide: You can force PI to start and stop drawing. This enables different indicators and settings in a single presentation (thanks for the question/suggestion Mathilde from France).
- 1.922 Added: The possibility of making the outline completely invisble. Thanks for the question/suggestion Temmink.
- 1.92 New features: Display Sections (Full, Space Only, None) and Indicators (All, Only Active, None) to handle very large presentations better (NickW); corrected bug that Tomás reported - again.
- 1.91 Corrected bug with new feature of 1.9 (thanks Tomás)
- 1.9 Added feature to set width of PI to shapes or sections
- 1.864 Added Repeat-Feature that was requested by two users
- 1.862 Corrected custom images hint (transparency, background and fill do work with images if they have transparent background)
- 1.86 Added the option to use custom images instead of predifined symbols as indicators.
- 1.85 Added a progress indicator for the progress indicator: A windows will give you information about the creation process and allow you to cancel it.
- 1.8395 added a Preview-button that allows creating the PI for a few slides (much faster until you have found the perfect settings for your presentation.
- 1.8394 added transparency for sections and indicators. Added Ignore Indicators usefull for large presentations. Added saving line thickness and styles to the presentation.
- 1.838 corrected a bug (thanks Zulfi) that occured when you tried to open PI from the slide master
- 1.837 added possibility to check online for a new version (in Help form), added (out)line formating: thickness, style, dashstyle
- 1.835 added the Fill A/S/U and BG A/S/U options to enable filled shapes/sections depending on their position in the presentation
- 1.831 added options to mark indicator of active frame as well as text and backgroundcolor of active section
- 1.828 corrected indicator size dropdown list
- 1.827 introduced new special section title "PISectionHidden": None of the slides in a section with this name will get an indicator and/or section title
- 1.826 added new dropdown "Gap". Two icons in ribbon changed. Removed beep sound
- 1.825 bug fixes (now 1000+ fonts possible), two icons in ribbon changed
- 1.824 bug fixes, two icons in ribbon changed
- 1.821 initial release
